Technical analysis for day trading means reading price charts to decide where to enter, where to put a stop and when a trade no longer deserves to be held. A day trader opens and closes positions within one session, so the work happens on shorter timeframes and needs quick, repeatable reads. This guide is a hub. It explains the core tool families, shows which question each one answers and links to a dedicated guide for each tool. It also shows how those tools sit inside a prop firm’s loss limits, which matter more than any single indicator.
What technical analysis for day trading means
Technical analysis studies price and, where it is available, volume. Its premise is that price already reflects what the market knows, and that recurring patterns in how price moves can help a trader frame a decision. That premise is debated. Treat the tools as context and a way to organise your thinking, not as proof that a trade will work.
Day trading narrows the question. A swing trader might ask whether a trend will last for weeks. A day trader asks whether there is a level, a trend or a shift in momentum worth trading in the next few hours, where the trade is wrong, and how much that wrong trade would cost. Those three questions drive the tools you pick.
The five tool families
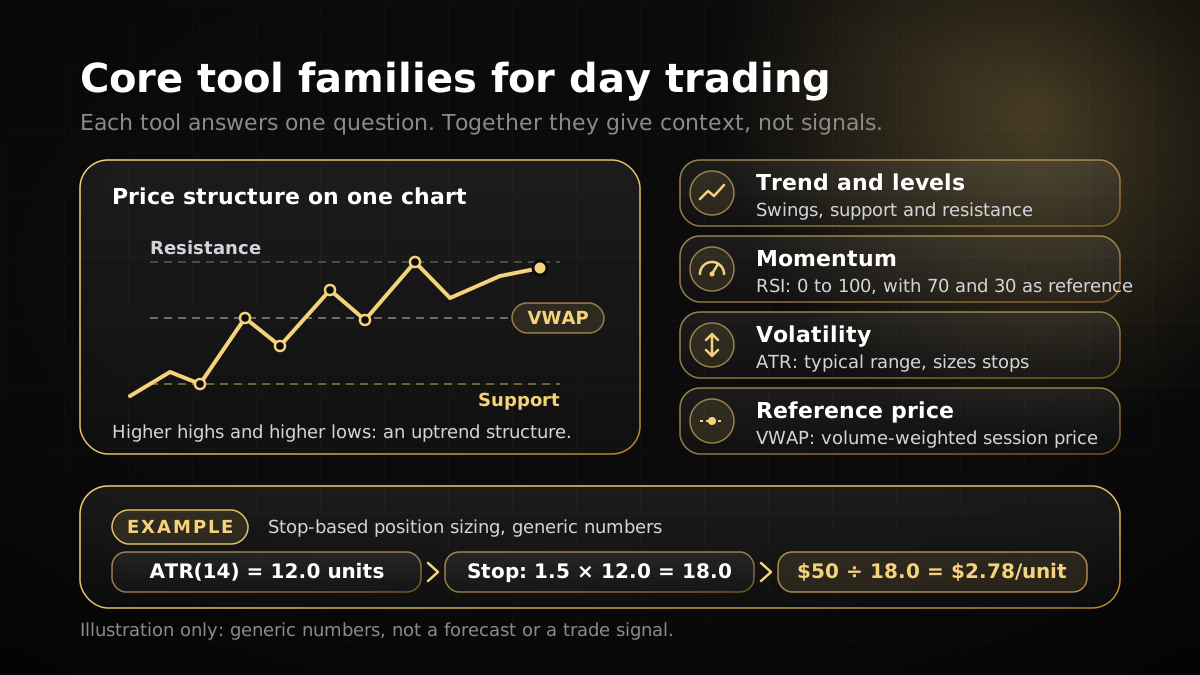
Most day-trading tools fall into five families. Each answers a different question, and overlap between families is where most charts become cluttered. The table below shows the question each family answers and the guide that explains its main tool.
| Family | Question it answers | Common tools |
|---|---|---|
| Trend and structure | Which way is price moving, and has the sequence of highs and lows changed? | Swing points, break of structure, moving averages |
| Levels and zones | Where have buyers or sellers acted before, and where might they act again? | Support and resistance, supply and demand zones |
| Momentum | How strong is the move, and is it stretched or losing pace? | RSI |
| Volatility | How far does price usually travel in a bar or a session? | ATR |
| Volume and average price | Where is the session’s average price, and is price above or below it? | VWAP |
Chart patterns sit across these families. They describe shapes made by price over time, such as triangles or double tops, and are best read as context for the structure and levels around them.
Trend and market structure
Structure is the starting point for most day traders because it shows direction. In an uptrend, price usually makes higher highs and higher lows. In a downtrend, it makes lower highs and lower lows. A trader marks the swing points that matter and watches for the sequence to change.
A break of structure is one way that change is described. It happens when price moves beyond a prior swing point in the direction of the trend, which tends to confirm the trend is still in force. A move that breaks the opposite way is a sign the trend may be weakening, although one break is not a reversal on its own. The break of structure guide covers how traders mark these points and how they differ from a change of character.
Moving averages are the other common trend tool. They smooth price over a set number of bars, so they lag. Many day traders use one fast and one slow average to see whether price is above or below the trend, but the averages add little if the structure already says the same thing. Pick one trend read and use it consistently.
Support, resistance and zones
Support is a price area where buying has previously stopped a fall, and resistance is an area where selling has previously stopped a rise. Traders mark these areas because they often attract orders again. The idea is an area, not an exact line, so a level drawn on one price tick will be missed by most real moves.
Supply and demand zones take the same idea further. A demand zone is a base from which price rose sharply, and a supply zone is a base from which price fell sharply. Traders watch how price returns to these zones and reacts there. The supply and demand zones guide explains how to mark them and where traders place stops around them.
A level is only useful if you can say where you are wrong. If a support area fails, the trade idea behind it is no longer valid, so the stop belongs just beyond the area, not at an arbitrary distance. This is where volatility comes in, because a stop that is too tight for normal movement will be hit by noise.
Momentum with RSI
Momentum tools measure how fast price has been moving. The Relative Strength Index, or RSI, is the most widely used. It scales recent gains against recent losses onto a fixed range, and traders often watch readings above 70 and below 30 as reference points.
Those levels are not entry signals. In a strong trend, RSI can stay above 70 or below 30 for a long time, so a trader who sells every overbought reading will fight the trend repeatedly. A more useful read is divergence, where price makes a new high but RSI does not, which suggests momentum is fading. Even then, it is one piece of context. The RSI guide explains the calculation and the settings to check before you rely on it.
Volatility with ATR
Average True Range, or ATR, measures how far price typically moves over a set number of bars. It does not say which way price will go. It says how large the moves usually are, which makes it a practical tool for setting stop distances.
A common approach is to place the stop a multiple of ATR away from entry, so the stop sits outside normal noise. The multiple is a choice you make and test, not a rule. A trader who uses 1.5 times ATR and a trader who uses 2 times ATR are taking different risks on the same chart. The ATR guide covers the true range calculation and how to read the value.
Volume and average price with VWAP
Volume-weighted average price, or VWAP, is the average price of a session weighted by volume. On intraday charts it usually resets at the start of each session, so it shows where most of the session’s trading has happened so far. Traders watch whether price is holding above or below it.
One caveat matters on MetaTrader 5. Forex and CFD volume on many brokers and platforms is tick volume, which counts price changes rather than traded units. VWAP built on tick volume is still a useful reference, but it is a proxy. Check how your platform calculates volume before you treat VWAP as a measure of real traded size. The VWAP guide explains the formula in more detail.
Worked example: sizing a trade from ATR
The arithmetic below is hypothetical and is shown only to illustrate the method. It is not a recommendation for any instrument or size.
Take a $10,000 account on a 1-Step Pay Later programme. Taking the $10,000 starting balance as the base (the rules do not state the base; check your dashboard), the Yo Pips percentages give a daily loss limit of 4%, about $400, and a maximum loss limit of 8%, about $800. You decide to risk 1% of the account per trade, which is $100. Assume one pip is worth $10 per standard lot on this pair.
- ATR(14) on the 15-minute chart reads 8 pips.
- Stop distance: 1.5 × 8 pips = 12 pips.
- Position size: $100 ÷ (12 pips × $10 per pip per lot) = $100 ÷ $120 = 0.83 standard lots, rounded down.
- Daily check: three full stop-outs of $100 bring the day to $300 of loss. A fourth full loss would reach the $400 limit, so the plan stops trading after the third loss, with a margin left for costs.
The example also shows that the stop comes from the market and the size comes from the account. The chart sets where the idea is wrong. The loss limit sets how big the trade can be. Confirm the contract size and the minimum lot step on your platform, because a broker may round the size differently. The position size calculator guide walks through the same formula with more inputs.
Chart patterns as context
Chart patterns are shapes such as triangles, flags, head and shoulders and double tops. They are popular because they are easy to see, but they are easy to see after the fact too. A pattern is most useful when it lines up with structure and a level, and when the invalidation point is clear before you enter.
Keep the pattern in its place. If a pattern requires a breakout that never comes, the trade does not exist. Read the pattern alongside your structure and zones, and do not add a pattern to a chart just because the indicators agree. The chart patterns guide covers the main types and their limits.
Combining the tools without stacking signals
A common mistake is to pile on indicators until something agrees. Two oscillators that measure similar things will agree most of the time, and that agreement is not independent evidence. A cleaner approach is to build a short checklist that uses one tool from each relevant family and to write it down before the session.
- Bias: what is the structure on the higher timeframe, and is price above or below the trend read?
- Location: is price at a level or zone that defines where the idea is wrong?
- Timing: has momentum confirmed the move, or has it faded at the level?
- Risk: what is the ATR-based stop, the position size and the remaining daily buffer?
- Exit: what would make the idea invalid, and what would close the trade for a profit?
If any step fails, there is no trade. That discipline matters more than the choice of tool, because most losses on a day come from trades taken without a clear invalidation point.
Technical analysis inside prop firm loss limits
On a prop firm evaluation or funded account, the tools are secondary to the loss limits. Under the Yo Pips rules page, the daily loss counts closed profit and loss, floating profit and loss, commissions and swaps for the current day, and it resets at UTC. A losing open trade therefore reduces your buffer straight away, even if your chart says the trade is still valid. Checkout terms take precedence over the rules page, and the rules can change, so check both before you trade.
The same rules page says EAs and indicators are allowed unless they break a prohibited-practice rule. Latency arbitrage, high-frequency or feed-delay exploitation, account or device sharing, and strategies built to exploit the simulated environment are prohibited. Overnight holding is allowed. Check the current rules page for scalping, news and weekend rules before you apply any of these tools to a particular session.
Use the free trial to practise your process before you commit to a paid programme. A free trial runs on a simulated account with no payment details, so you can test the checklist above without risking a fee.
Frequently asked questions
01Is technical analysis reliable for day trading?
02Which tool should a beginner learn first?
03How many indicators should I use on one chart?
04Can I use technical analysis on a prop firm account?
05Which timeframe should I use for intraday technical analysis?
06Is day trading the same as scalping?
Risk disclosure: Trading leveraged products such as forex and CFDs carries a high level of risk, and most traders lose money. Prop firm challenges are evaluations on simulated accounts; passing one does not guarantee account activation, profits or a payout. Nothing on this page is investment advice. Always read the current rules and terms before you buy or start a challenge.