Supply and demand zones are areas on a price chart that traders mark because price reacted strongly there in the past. The phrase also appears in economics, where supply and demand describe how prices settle. This guide uses the trading meaning only. It explains what a supply zone and a demand zone are, how traders mark them, how they differ from support and resistance, and how to size a trade when price returns to one. Nothing here is a promise of results.
What a supply and demand zone is
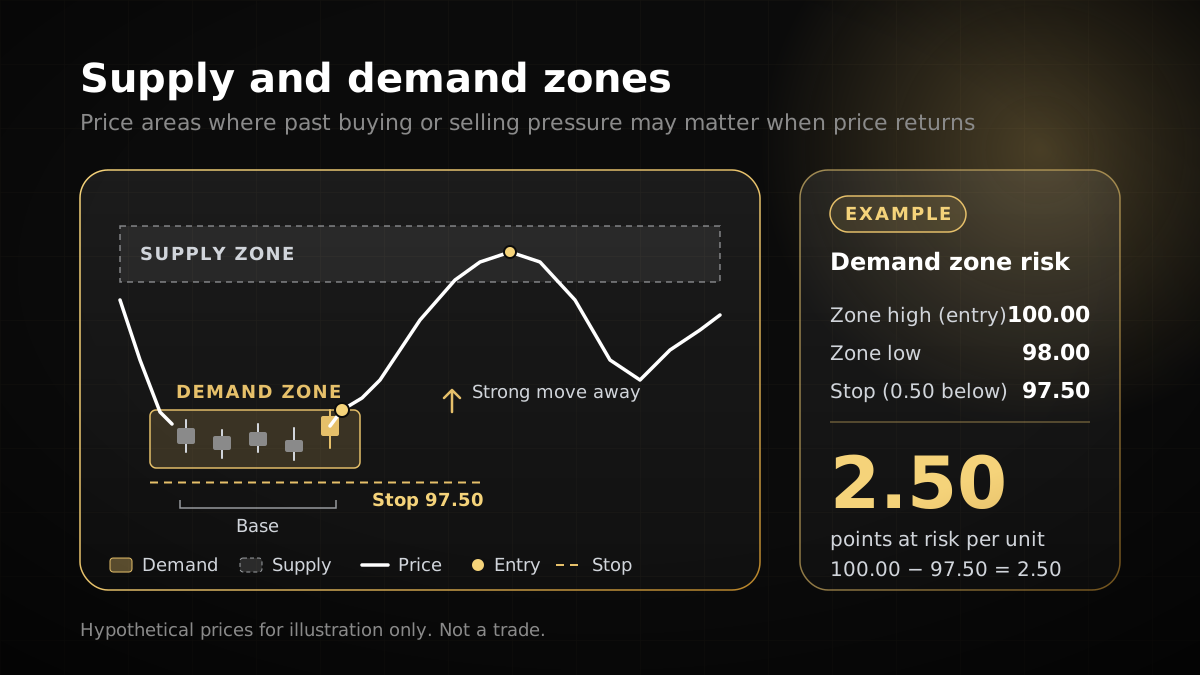
A zone is a band of price, not a single line. It is drawn around a small group of candles where the market paused before a strong move. That pause, often called the base, is often read as showing that orders on one side were absorbed by the other. When price then moves sharply away, the zone marks where the imbalance began.
A supply zone is drawn over a base where price stalled after an advance and then dropped. Traders read it as an area where sellers were strong enough to push price down. A demand zone is drawn over a base where price stalled after a decline and then rose. Traders read it as an area where buyers were strong enough to lift price.
The idea is a reading of past behaviour, not a law of markets. Price may return to a zone, react, and carry on in the same direction. It may also pass straight through. Both outcomes are normal, which is why the plan for each case matters more than the label on the zone.
If you want the wider context for these ideas, our chart patterns guide covers other shapes traders use to read a chart.
Supply zones and demand zones compared
The two zone types are mirror images. The table below sets them side by side. The labels describe how traders read the chart, not what will happen next.
| Feature | Supply zone | Demand zone |
|---|---|---|
| Built from | A base followed by a sharp fall in price | A base followed by a sharp rise in price |
| Traders read it as | An area where sellers were strong | An area where buyers were strong |
| Typical question on a return | Does selling pressure appear again? | Does buying pressure appear again? |
| Stop placement, if traded short or long | For a short, beyond the top edge | For a long, beyond the bottom edge |
How zones differ from support and resistance
Support and resistance are older and simpler ideas. A support level is a price where buying has turned price up before, and resistance is a price where selling has turned it down. Both are usually drawn as lines.
Zones add two things. They are areas rather than lines, so they allow for price that overshoots a level by a little. They also link the area to the move that created it, so the reading starts from the base and the strong move away from it. Many traders use both types of level on the same chart.
The main practical difference is the edge. A line gives one price. A zone gives a range, so the stop loss and the entry have to be placed with judgement, and the width of the zone determines how far the stop sits from the entry. That is why the position size, not only the chart, needs to be checked before you trade.
How to mark a zone on a chart
Marking zones is a process, and a repeatable one is worth more than a clever-looking chart. These steps describe a common approach. Adapt them to your own written rules.
- Choose your timeframe first. Mark zones on the timeframe you plan to trade, then check a higher timeframe to see which zones sit inside a larger move.
- Find the base. Look for a few candles where the range narrows and price stalls before the next move.
- Confirm the move away. The base should be followed by a clear, impulsive move that leaves the base behind. Define what counts as impulsive in your rules, and apply the same test every time.
- Draw the zone. Use a rectangle from the top to the bottom of the base. Choose one edge method, either candle bodies or full wicks, and use it on every chart.
- Record the zone. Note whether price has returned to it since. Some traders treat an untested zone as fresher, but that is a convention, not a proven rule.
- Write the plan before price arrives. State what you will do if price reaches the zone and reacts, what would make you step aside, and where the stop loss goes.
Keep the chart simple. A chart with a zone at every swing has no zones, only shaded areas. Mark a small number of zones that meet your rules and leave the rest unmarked.
Worked example: a demand zone and position size
This example uses hypothetical prices to show the arithmetic. It is not a real trade and it is not a recommendation. Assume a pair where one pip is worth $10 per standard lot.
- Demand zone: bottom at 1.1000, top at 1.1020. The zone is 20 pips wide.
- Planned entry: at the top of the zone, 1.1020, on a long trade.
- Stop loss: 5 pips below the bottom of the zone, at 1.0995. The stop distance is 1.1020 minus 1.0995 = 0.0025, which is 25 pips.
- Account: $10,000, with 1% risk per trade, which is $100 at risk.
The position size is the amount at risk divided by the cost of one lot over the stop: $100 / (25 pips x $10 per pip) = $100 / $250 = 0.40 lots. If the stop is hit, the loss is 25 pips x $10 x 0.40 = $100, which is the planned 1%. The same method is set out in our position size calculator guide.
Now the target. Suppose the next supply zone sits at 1.1080, which is 60 pips above the entry. If price reaches it, the gain is 60 pips x $10 x 0.40 = $240, about 2.4 times the $100 risked. That ratio is only a description of this one plan. It does not show that the trade is likely to win, and the stop loss would cost the same $100 whether or not the zone held in other trades.
Notice what the example does not include. There are no commissions, swaps or slippage, and price could gap through the stop. Add those costs to the plan before you rely on the numbers.
Managing risk around a zone
A zone gives you a place to exit if you are wrong. Use it. Place the stop loss beyond the far edge of the zone, so the trade is invalid when price closes through the base. Then size the position from the distance to that stop, as in the example above. Moving the stop further away when price approaches the zone changes the trade into a different one, and it usually increases the loss you accept.
Zone trades also have to fit the rest of your account. A single stop loss uses part of your daily allowance, and any other open trade uses more. On a prop firm evaluation, that matters a great deal. Under the Yo Pips rules page, the daily loss figure includes open trades as well as closed ones, so a losing zone trade counts before you close it. Checkout and promotion terms take precedence, and rules can change, so check the current version before you trade. Our prop firm challenge guide explains how the loss limits work.
Keep a written journal of every zone and every trade taken from it. Record the zone, the stop, the size, the outcome and whether you followed the plan. After a few weeks, you will see whether your rules are being applied the way you intended, which is more useful than any single result.
Common mistakes with zones
- Drawing the zone after the move. Once you know where price went, almost any base looks like a clear zone. Mark zones before you know the outcome.
- Marking too many zones. When every swing has a zone, no zone carries any information. Keep only the zones that meet your written rules.
- Treating a zone as a guaranteed reaction. A zone can fail to hold, so plan for both outcomes.
- Ignoring the wider trend. A demand zone inside a strong downtrend on a higher timeframe needs a different plan from one inside an uptrend.
- Moving the stop. A stop that keeps moving away from the zone is no longer protecting the plan.
- Judging the method on a few trades. A handful of wins or losses says little. Test written rules on past charts over a meaningful number of examples before you risk real or prop capital.
This guide does not quote win rates or test results for zones. If you see a figure for them elsewhere, check how it was measured before you rely on it. For market data and definitions, official exchange and central bank pages are a better reference than a chart-reading article.
Frequently asked questions
01Is a supply and demand zone the same as support and resistance?
02Are supply and demand zones a reliable entry signal?
03How wide should a zone be?
04Does a zone stop working after price returns to it?
05Where should a stop loss go when trading a zone?
Risk disclosure: Trading leveraged products such as forex and CFDs carries a high level of risk, and most traders lose money. Prop firm challenges are evaluations on simulated accounts; passing one does not guarantee account activation, profits or a payout. Nothing on this page is investment advice. Always read the current rules and terms before you buy or start a challenge.