Chart patterns are the shapes price draws over many bars: a head and shoulders, a double bottom, a triangle or a flag. Traders use them to describe the structure of a move, to set a level where the idea is wrong and to decide whether a trade is worth taking. On a prop firm account the pattern is only half the decision. The other half is how much you can lose before the firm’s loss limit ends the attempt.
What chart patterns are
A chart pattern is a recognisable arrangement of highs, lows and trendlines. Most are drawn with a neckline, a support or resistance line, or a pair of converging or parallel trendlines. The idea is that price tends to react in a similar way when it forms the same structure, because many traders watch the same levels.
That idea has limits. Patterns describe what price has done and where it is now. They do not say what happens next. Two traders can draw the same chart and disagree on where the pattern starts and whether a break is real. A pattern is useful only with a clear definition, a defined invalidation level and a rule for what you do if it fails.
Patterns at a glance
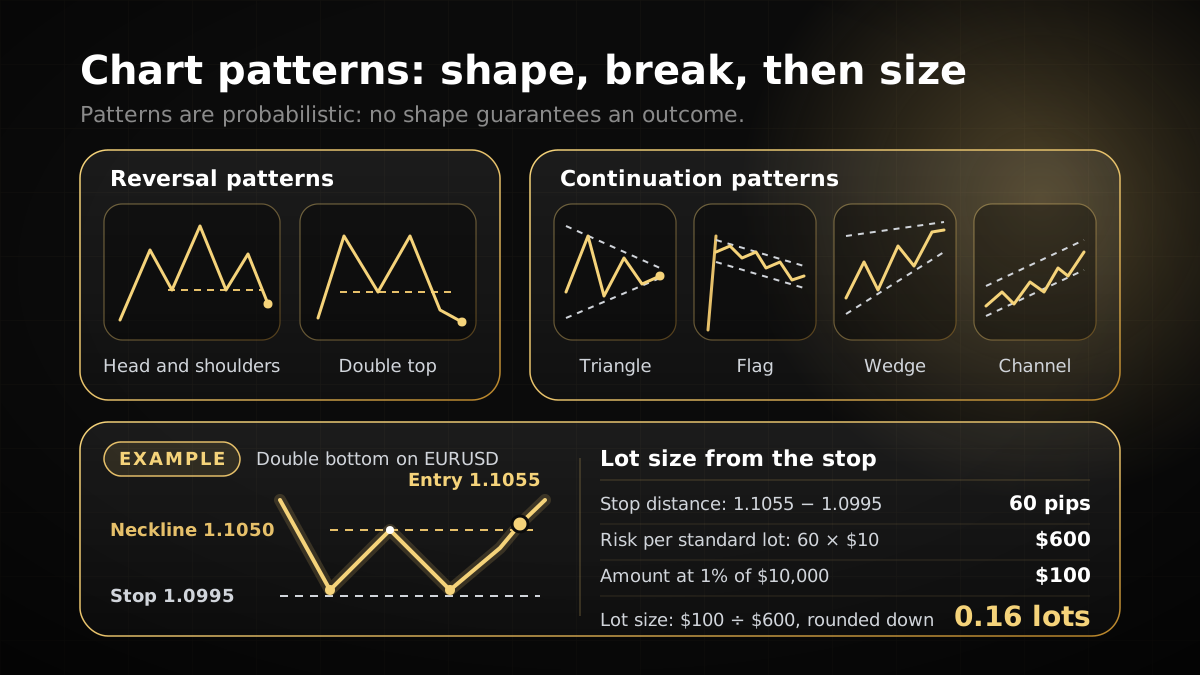
The table groups the main patterns by what they usually suggest. Treat the grouping as a starting point.
| Pattern | Usually grouped as | What it looks like |
|---|---|---|
| Head and shoulders | Reversal (inverse is bullish) | Three peaks, the middle one highest |
| Double top and double bottom | Reversal | Two peaks, or two troughs, at about the same level |
| Triangles | Mostly continuation; symmetrical ones can break either way | Price squeezes between converging trendlines |
| Flags and pennants | Continuation | A sharp move, then a short pause against the trend |
| Wedges | Can be reversal or continuation | Two trendlines sloping the same way and converging |
| Channels | Continuation while the channel holds | Parallel trendlines that contain price |
Reversal patterns
A reversal pattern forms at the end of a trend. Its shape alone confirms nothing. Traders usually wait for a break of the key line.
Head and shoulders
A head and shoulders has three peaks. The middle peak, the head, is higher than the two shoulders. A line under the two troughs between the peaks is the neckline. A close below the neckline after an uptrend is the bearish signal. The inverse, with three troughs and the middle one lowest, is the bullish version after a downtrend. Some traders project the distance from the head to the neckline as a rough target. That is a convention for setting a target, not a forecast that price will reach it.
Double top and double bottom
A double top has two peaks at roughly the same level, with a trough between them. The neckline is the low of that trough, and a close below it completes the pattern. A double bottom is the mirror image. The shape is simple, but it is easy to call a double top where there is only a pause. Check that the peaks really sit at a similar level and that the break is a clear close, not a wick.
Continuation patterns
A continuation pattern forms inside a trend. Price moves, pauses in a structure and, if the pattern holds, carries on. The pause gives a defined level to trade from and a defined level to be wrong about.
Triangles
A triangle forms when highs and lows squeeze between two trendlines. An ascending triangle has a flat top and rising lows. A descending triangle has a flat bottom and falling highs. A symmetrical triangle has both lines converging. Ascending and descending triangles are usually read with the break in the direction of their flat side. A symmetrical triangle has no built-in direction, so wait for the first clear close outside the lines.
Flags and pennants
A flag follows a sharp move, the flagpole, and then a short pause in a channel that slopes against that move. A pennant is the same idea with a small symmetrical triangle as the pause. In an uptrend, a break above the upper edge is the continuation signal. The pattern works best when the pause is short and orderly. A long, loose pause that drifts back into the old range is a weaker shape.
Wedges and channels
Wedges
A wedge has two trendlines that slope the same way and converge. Rising wedges are often read as bearish and falling wedges as bullish, but both can act as reversal or continuation patterns depending on where they form. Use the break of the lower line in a rising wedge, or the upper line in a falling wedge, as the reference. Do not assume the direction of the break in advance.
Channels
A channel is two parallel trendlines that contain price. In an uptrend the lower line is support and the upper line is resistance. A close outside the channel is the point where the structure has changed.
How reliable are chart patterns?
Chart patterns are not rules. They are structures a trader interprets, and three factors make them less reliable than their clean diagrams suggest.
- Subjectivity. Where a trendline starts, which swing counts and how far a break must go are judgement calls. Two people can see different patterns on the same chart.
- False breaks. Price often moves through a neckline or trendline and returns. A break that fails quickly is one of the most common ways a pattern trade goes wrong.
- Context. The same shape can behave differently in a strong trend, in a quiet range or around a news release. Read a pattern against the wider chart.
Published success rates for chart patterns often rest on small samples, different definitions or undisclosed filters, so this guide quotes none. A better test is your own record: the definition you used, the entry, the stop, the result and whether the pattern was still valid when you entered.
Invalidation and stop placement
Every pattern trade needs an invalidation level: the price at which the idea is wrong. The stop goes there, or just beyond it, not at a distance you would like to afford.
- Head and shoulders. For a bearish short, invalidation is a decisive close back above the right shoulder, or above the head if the shoulder has already failed.
- Double bottom. Invalidation is a close below the lower of the two lows.
- Triangle or wedge. Invalidation is a clean move back through the broken trendline, or back inside the pattern after a break that did not hold.
- Flag or pennant. Invalidation is a close below the pause on the opposite side. The pause has then become a reversal rather than a rest.
- Channel. Invalidation is a close outside the channel on the far side of the trade.
Add a small buffer beyond the invalidation level for spread and normal noise. A stop far past it lets the pattern fail without a clear signal. If the stop distance is too large for the size you can afford, skip the trade. Do not shrink the stop to make a trade fit.
Sizing inside a prop firm loss limit
Sizing starts from the stop, not the target. Once invalidation is set, the stop distance is known, and the lot size is the amount you can lose divided by the cost of one lot over that distance. The full method is in our position size calculator guide. This section applies it to pattern trades on a prop firm account.
Take a hypothetical $10,000 account on the 1-Step Pay Later programme. Under the Yo Pips rules page, checked on 9 November 2026, the daily loss limit is 4% and the maximum loss limit is 8%. Applied to the $10,000 starting balance, that gives a daily room of $400 and a maximum loss room of $800, so equity must stay above $9,200. Check how your dashboard sets the base before you trade.
Suppose EURUSD has formed a double bottom. Both lows sit at 1.1000 and the neckline is at 1.1050. Price closes above the neckline at 1.1055, which is the entry. Invalidation is a close below the lower low, so the stop goes 5 pips beneath it, at 1.0995. The stop distance is 1.1055 minus 1.0995, which is 0.0060, or 60 pips. On a USD account, one pip on a standard lot is worth $10.
- Risk per standard lot: 60 pips x $10 = $600.
- Amount at 1% risk: 1% of $10,000 = $100.
- Lot size: $100 / $600 = 0.1666, rounded down to 0.16 lots.
- Actual risk at 0.16 lots: 0.16 x $600 = $96.
Now check the daily room. One standard lot would risk $600 on a single stop, more than the whole $400 daily limit, so one stop would breach the account. At 0.16 lots, each full stop costs $96. Four full stops total $384, which leaves $16 of the $400. Spread, commission and swap on each trade come out of that $16 too, so four losing trades could breach once costs are counted. A personal ceiling of three losses a day, or $288, leaves more margin for error.
A valid pattern can still be too wide for the room. A 120-pip stop would cost $1,200 per standard lot, and 1% risk would allow only 0.08 lots. In that case, skip the trade or wait for a cleaner setup.
Floating losses count too. A trade $80 down on this account has already used 20% of the $400 before it closes.
Yo Pips rules that affect pattern trades
The figures in this guide come from the Yo Pips rules page, checked on 9 November 2026. Checkout and promotion terms take precedence over the rules page, and rules can change, so confirm the current version before you buy or trade. The limits that matter most for pattern trading are these:
| Programme | Daily loss limit | Maximum loss limit | What counts toward the daily limit |
|---|---|---|---|
| 1-Step Pay Later | 4% | 8% | Closed P/L, floating P/L, commissions and swaps for the current UTC day |
| 2-Step Pay Later | 5% | 10% | Closed P/L, floating P/L, commissions and swaps for the current UTC day |
| Instant Funding | 3% | 6% | Closed P/L, floating P/L, commissions and swaps for the current UTC day |
Three rules shape pattern trades. A breach is immediate and closes the account. The profit target counts closed profit only, so an open pattern trade does not count until it is closed. Overnight holding is allowed, so a pattern can run past the session. Scalping, news trading and weekend holding have their own rules, which this guide does not restate. Check the current rules page before you trade around an event or a weekend.
For how the fee works across a pass, see our pass first, pay later page.
Common mistakes
- Seeing the pattern you want. Drawing the neckline after the move, or stretching a trendline until it fits, turns a guess into a signal.
- Moving the invalidation. Widening the stop after a pattern starts to fail usually turns a planned loss into a larger one.
- Ignoring the daily room. Several pattern trades in one session share the same daily limit. Add up the risk across open trades, not just the one in front of you.
- Sizing up after a loss. Taking the next pattern at a bigger size to recover a loss is a common route to a daily breach.
Frequently asked questions
01Do chart patterns work?
02What is the difference between a reversal and a continuation pattern?
03Where should the stop go on a chart pattern trade?
04How much of a prop firm daily loss limit should one pattern trade use?
05Are chart patterns the same as candlestick patterns?
06Can I hold a chart pattern trade overnight on Yo Pips?
Risk disclosure: Trading leveraged products such as forex and CFDs carries a high level of risk, and most traders lose money. Prop firm challenges are evaluations on simulated accounts; passing one does not guarantee account activation, profits or a payout. Nothing on this page is investment advice. Always read the current rules and terms before you buy or start a challenge.