SMC trading, short for smart money concepts, is a way of reading price charts that is popular in retail trading communities, often through videos, paid courses and social media. It uses a shared vocabulary: market structure, liquidity, order blocks, fair value gaps and premium and discount zones. This guide explains what those terms are meant to describe, how traders combine them, why the framework is hard to test, and what a prop trader should check before using it on an evaluation or funded account.
What SMC trading is
SMC is not one published method with one rulebook. It is a set of terms that educators teach in different ways, so two people who both say they trade SMC may enter for different reasons. Most versions share a basic view. Price moves in swings, those swings leave levels that traders watch, and the way price reacts at those levels is used to plan entries and exits.
SMC materials also often describe price as being driven by large participants whose orders leave traces on the chart. That is an interpretation of what price does. A chart does not show who placed an order, so this guide does not treat that description as established fact, and you should be wary of any source that presents it as one.
Because SMC is a way of looking at charts rather than a fixed set of signals, the same chart can be marked in several ways. Before you use the framework, decide which definitions you will apply, write them down, and review your trades against them. Without that step, it is hard to tell whether a method is working or whether the explanation has simply been fitted to the outcome. For the liquidity side of the framework, read our liquidity in trading guide.
The core terms, defined
The table lists the terms you will meet most often. The definitions are common descriptions, not standards. Practitioners disagree on details such as which candle counts as an order block, so treat each row as a starting point for your own rules.
| Term | What it usually describes | Common caveat |
|---|---|---|
| Market structure | Swing highs and lows, and whether price is making higher highs and higher lows or the reverse | Swing points depend on the lookback you choose, and a higher timeframe can read differently |
| Break of structure (BOS) | A close beyond a prior swing point in the direction of the trend | Some traders use other labels for the same move, so define yours |
| Liquidity | Clusters of visible highs or lows, such as equal highs or equal lows, where stop orders are often assumed to sit | Liquidity is an assumption about where orders sit, not something a chart shows directly |
| Liquidity sweep | Price trades briefly beyond a level and then reverses | Price also breaks levels and keeps going, so a sweep is only clear after the fact |
| Order block | The last opposing candle, or a zone within it, before a strong move | Definitions vary, and many traders draw the zone differently |
| Fair value gap (FVG) | A gap between the wicks of three consecutive candles, where the middle candle moved sharply | Price often returns to gaps but does not always trade through them, so a gap is not a signal on its own |
| Premium and discount | The upper and lower halves of a price range | The halves are a convention and say nothing about direction on their own |
Zones in SMC are closely related to the idea of supply and demand. Our supply and demand zones guide covers that background in more detail.
Many traders chain these ideas into a sequence: mark the structure, wait for a break, look for liquidity to be taken, then look for an order block or gap to use as an entry zone. Each step is a judgment call. The sequence is only as consistent as the definitions behind it, and a sequence that changes from trade to trade is hard to review.
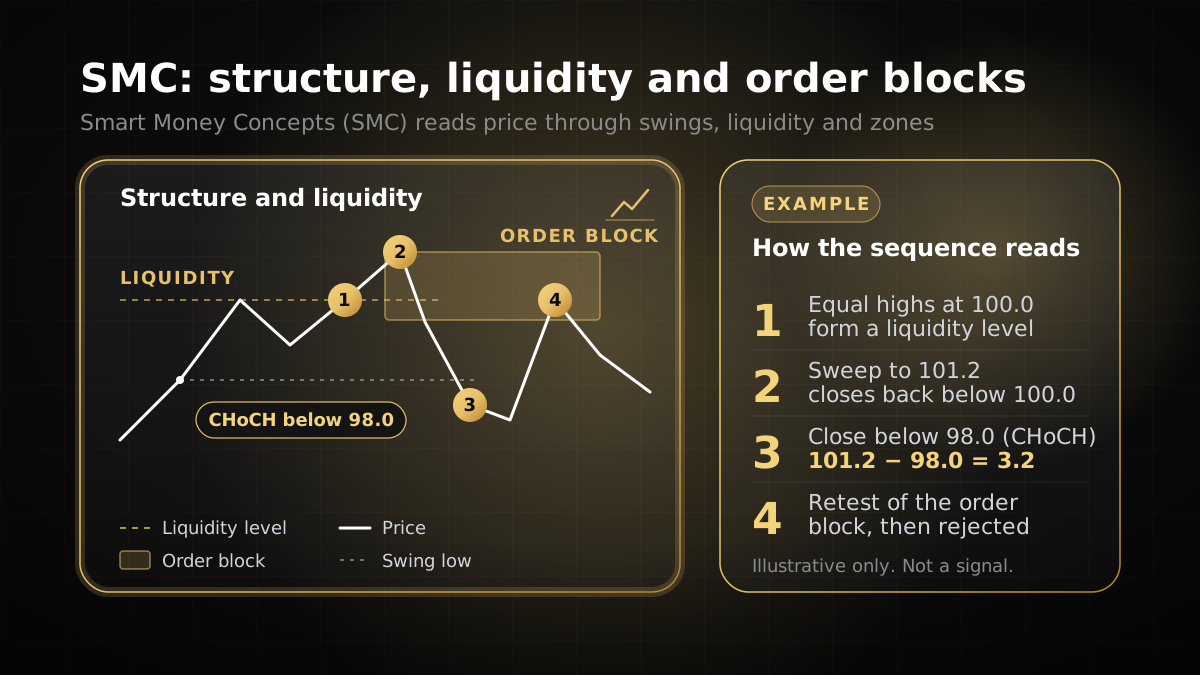
The figure follows four steps. They are also written out here, so they can be read on any screen:
- Equal highs at 100.0 form a liquidity level, which is an assumption about where stop orders may sit.
- Price sweeps to 101.2 and closes back below 100.0.
- A close below the 98.0 swing low is labelled a change of character (CHoCH), because it breaks the level the rally was built on. The distance from 101.2 to 98.0 is 3.2 points.
- Price returns to the 99.5 to 101.2 order block, is rejected, and falls.
Worked example: sizing a trade around a structure stop
Take a hypothetical trader with a $10,000 evaluation account who risks 1% of the balance on each trade. The numbers below show the arithmetic only. They are not a recommendation or a described setup.
- Risk per trade: 1% of $10,000 = $100.
- Stop: 20 pips beyond the far edge of an order block zone, as marked before the move.
- Pip value: $10 per pip for one standard lot on a USD-quoted pair such as EURUSD. Pip values differ by pair and account currency, so check your broker’s contract specification.
- Position size: $100 ÷ (20 pips × $10 per pip per lot) = $100 ÷ $200 = 0.5 lots.
- Check: 0.5 lots × 20 pips × $10 = $100, the amount you chose to risk.
The stop comes from the structure, and the size comes from the risk. Suppose the same trader decides the zone needs a 50-pip stop. The arithmetic gives $100 ÷ (50 × $10) = 0.2 lots. The idea is the same, but the position is smaller, because the framework does not reduce the cost of being wrong. Only the size does that. Our position size calculator guide explains lot sizing in more depth.
Now add the firm’s limits. Under the Yo Pips rules page, the 1-Step Pay Later daily loss limit is 4%, which is $400 on this hypothetical balance. Check the rules page for which balance the percentage is measured on. Two $100 losses in one day use half of that allowance. A losing open trade counts toward the daily limit straight away, so an open trade that moves against you can use up the allowance before you decide to close it. For how daily and maximum limits fit into a challenge, see our prop firm challenge guide.
What the evidence says
As of 9 November 2026, we are not aware of any published, independent evidence that SMC outperforms other trading methods, and this guide does not claim that it does. The material most people find on SMC is educational content, paid courses or chart commentary. Much of it cannot be tested against a fixed set of rules, and it is rarely shown with complete, verifiable trade records.
Two practical points follow. First, testing SMC is difficult because its definitions are loose, so the same chart can support more than one reading. Second, a framework can look convincing on a handful of hand-picked examples and still lose money across many trades. The lack of evidence is not proof that SMC fails, but it means nobody should treat its claims as settled.
If you want to test it yourself, write the rules down before you look at results. Log every trade, including the ones you would rather forget. Compare your results with a simple baseline, such as the same entries taken without the framework’s filters, and check whether any difference holds over a meaningful sample rather than a few weeks.
Checking the rules before you use SMC
Any method has to fit the account it runs on. The points below come from the Yo Pips rules page. Checkout terms take precedence, and rules can change, so read the current version of the rules and regulations page before you trade.
- Indicators and expert advisors. These are allowed unless they break a prohibited-practice rule.
- Prohibited practices. Latency arbitrage, high-frequency or feed-delay exploitation, account or device sharing, and strategies built to exploit the simulated environment are not allowed. A setup that depends on feed delay or on the simulated environment falls into that list. Check the rules page for the full wording.
- Overnight holding. Holding a position overnight is allowed.
- Scalping, news and weekend rules. Some SMC entries are placed around fast moves, and some traders hold through the weekend. Check the current rules page for scalping, news and weekend rules before you apply a framework that does any of these.
- Floating losses. The daily loss limit counts floating P/L, so a losing open trade counts before you close it.
Use the limits as your sizing ceiling. Under the Yo Pips rules page, the 1-Step Pay Later figures are a 4% daily loss limit and an 8% maximum loss limit. Work out the risk per trade first, then check how many losing trades the daily limit allows before you need to stop for the day.
Where SMC approaches go wrong
- Reading the chart after the move. Once a sweep and a break have happened, almost any zone looks obvious. Mark levels before the move and record them in your journal.
- Too many zones. A chart with a dozen order blocks and gaps gives you a reason for nearly any trade. Keep one or two zones per idea.
- Treating a zone as a guarantee. Price can trade through an order block or a gap and keep going. A zone is where you decide the idea is wrong, not where it is proven right.
- Sizing from the setup, not the account. A tight-looking stop can still breach a daily limit if the position is too large for the balance.
- Ignoring costs. Spread, commission and slippage around news can move your fill away from the zone. The slippage guide explains how fills can differ from the price you expected.
- Using the story as the reason. SMC language can make a losing trade sound planned. Judge each trade against your written rules, not against the explanation you give afterwards.
Frequently asked questions
01Is SMC trading a strategy or a framework?
02Does SMC work?
03What is the difference between a break of structure and a change of character?
04What is an order block in SMC?
05Can I use SMC on a prop firm challenge?
Risk disclosure: Trading leveraged products such as forex and CFDs carries a high level of risk, and most traders lose money. Prop firm challenges are evaluations on simulated accounts; passing one does not guarantee account activation, profits or a payout. Nothing on this page is investment advice. Always read the current rules and terms before you buy or start a challenge.