If you searched for what is SMT in trading, you will find many short explanations that disagree on the details. SMT divergence is a chart comparison. You watch two markets that normally move together, and you notice when one makes a new high or low that the other does not confirm. The idea is simple to describe and harder to use well. This guide gives a definition, a worked example with the arithmetic shown, the main limits of the method, and how it fits into a risk plan.
What SMT means in trading
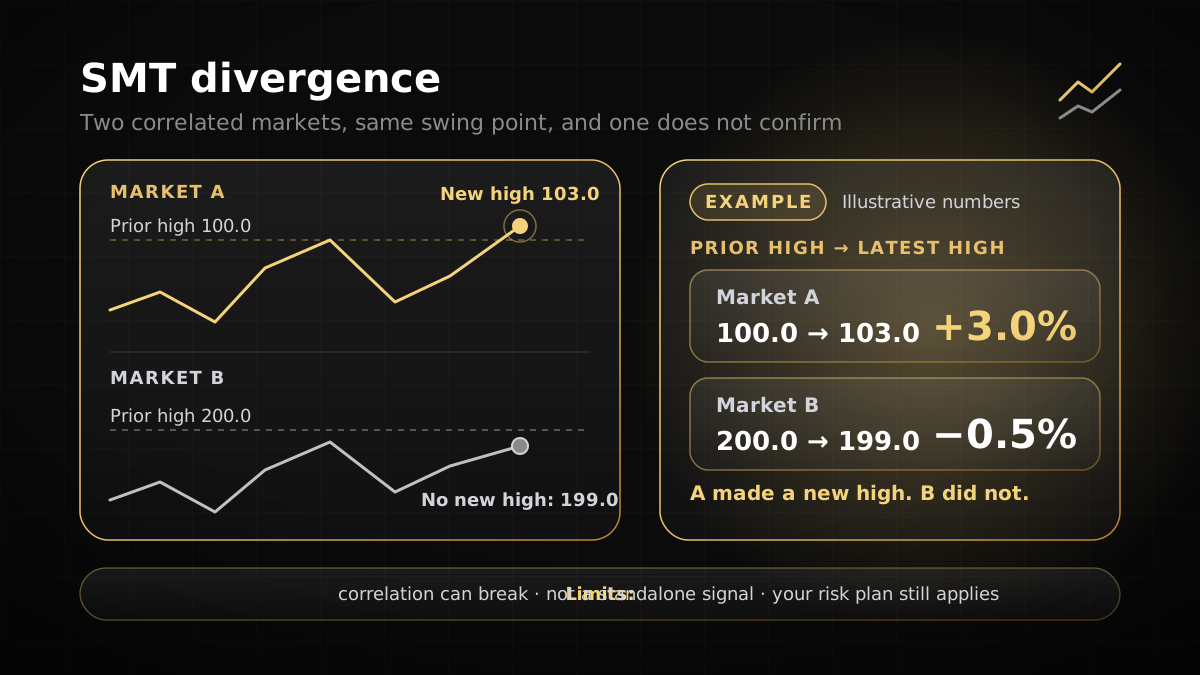
In trading, SMT refers to a comparison between related instruments. The name is not standardised, and some traders use the same abbreviation for other ideas. When you read a source, check what it means by SMT before you compare notes. In this guide, SMT divergence means one specific thing: two correlated markets are charted on the same timeframe, and at a turning point one market makes a new swing high or swing low while the other does not.
The reasoning is that correlated markets are usually driven by similar forces. If one breaks higher and the other does not follow, the leader may be showing strength the other lacks, or the breakout may be weaker than it looks. Traders treat that gap as information to investigate. The word divergence here describes a disagreement between two charts. It is not a forecast of where price will go.
Do not confuse this with divergence on an oscillator. Momentum divergence compares price with an indicator reading on one market. The RSI indicator guide covers that separate idea, and the two can be used together, but they answer different questions.
How an SMT divergence forms
The process is the same each time. Work through it in order and write down each step before you look for the next one.
- Pick two instruments with a stated reason to move together, such as two forex pairs that share a currency, or two equity index futures contracts.
- Mark swing highs and swing lows on the same timeframe, using one fixed rule for both charts. For example, a swing high is a candle with lower highs on both sides.
- Wait for one market to make a new high or low beyond its previous swing point.
- Check the other market for a matching new high or low within the same time window.
- If it does not match, you have a divergence. Note which market failed and the exact level where the failure happened.
Step two matters most. If you pick swing points after the move, you can always find a divergence, and the method stops testing anything. Write the swing rule down before you look at the chart. Swing points also tend to sit near areas where orders cluster, which is why the liquidity in trading guide is a useful companion to this one.
Choosing the pair
The pair does most of the work in this method. A weak pairing produces divergences that mean little, because the two markets were never likely to agree. Three common groups are listed below. Each has a caveat you should check before you rely on it.
| Pairing | Example | Why traders compare it | Main caveat |
|---|---|---|---|
| Equity index futures | E-mini S&P 500 and E-mini Nasdaq-100 | Both track large US equity indices and often react to the same macro news. | Sector mix differs, so one index can lead for reasons that do not apply to the other. |
| Forex pairs sharing a currency | EURUSD and GBPUSD | Both are quoted against the US dollar, so a dollar move can affect both. | Each pair has its own drivers, such as UK-specific news for the pound. |
| Precious metals | Gold and silver | Both often respond to the same interest-rate and dollar expectations. | The relationship is loose and can shift for long periods, so test it before use. |
Before you use any pair, run a simple check on your own data. Over the sessions you review, do the two markets move in the same direction most of the time? Count those sessions yourself. Do not rely on a published correlation figure unless you can trace its source and date, and remember that a relationship that held last year may not hold this year.
Worked example with illustrative prices
The prices below are illustrative. They are not real market data and they are not a recommendation to trade. The example uses EURUSD and GBPUSD on one London session chart, both on 15-minute candles, with the same swing rule applied to each.
| Market | Previous swing high | New high in session | Result |
|---|---|---|---|
| EURUSD | 1.1000 | 1.1012 | New high, 12 pips above the previous swing |
| GBPUSD | 1.2700 | 1.2695 | No confirmation, 5 pips short of the previous swing |
The arithmetic is simple. EURUSD moved from 1.1000 to 1.1012, which is 0.0012 or 12 pips, because one pip on a four-decimal pair is 0.0001. GBPUSD stopped at 1.2695, which is 0.0005 or 5 pips below its earlier high of 1.2700. EURUSD made a new high and GBPUSD did not confirm it, so the chart shows a divergence.
Two readings are possible. One trader might see the move in EURUSD as lacking support from GBPUSD and look for a short setup. Another might wait for the next swing before doing anything. Neither reading is confirmed by the divergence alone, and each needs its own stop and its own plan.
Suppose the first trader considers a short near 1.1012 with a stop 20 pips above, at 1.1032, which sits beyond the new high. On a $10,000 account at 1% risk, the amount at risk is $10,000 x 0.01 = $100. The stop distance is 20 pips. For this example only, assume the pip value for one lot is $10 per pip. That is an assumed input, not a market fact, and you should read the real pip value for your pair and account currency from your broker’s contract specification. At that assumed value, the risk per lot is 20 x $10 = $200. The size is $100 / $200 = 0.50 lots. A wider stop would cut that size, as the position size calculator guide explains in more detail. The entry, the stop and the example itself are for illustration only.
Reading the signal and its limits
A divergence can resolve in either direction. The failed market may catch up, or the leader may stall and reverse. The divergence tells you where to look, not how the next move will end. These are the main limits to keep in mind.
- Correlation can break. Two markets that moved together for weeks can separate around major news, session opens or thin trading.
- Contracts and feeds differ. Futures contracts roll to new expiries, and spot forex prices are not identical to futures prices. Compare like with like, and check which contract or symbol your platform shows.
- Timestamps can differ. Two charts from different data sources may print their highs at slightly different times. Where you can, use symbols from the same broker feed in MetaTrader 5, and check the candle times on both charts.
- One occurrence is weak evidence. A single divergence on a short timeframe tells you very little. Repeated observations on your own records tell you more.
The fairest way to test the method is to record every occurrence with the swing rule fixed in advance, including the ones that failed, and to measure the results without changing the rule afterwards. Testing only the examples that look convincing will always make the method look better than it is.
Using SMT with a risk plan
An SMT divergence should never change your risk per trade. Decide the risk percentage first, set the stop from the chart, and then size the position, as the worked example shows. A method that feels persuasive can tempt traders to size up, which turns a planned loss into a much larger one. Keep a written limit for each day and each week, and stop trading for the day when you reach it, whatever the chart looks like.
Losing reads come in runs, even with a sound method. Ten divergences in a row can all fail, and a trader who doubles size after each loss can lose a month of gains in one session. The prop firm challenge guide explains why loss limits matter more than any single setup when you trade a funded or evaluation account.
Yo Pips rules and this method
Yo Pips is an online proprietary trading firm. Traders take evaluations on a simulated account on MetaTrader 5, and for evaluation programmes, pass conditions apply before a funded account is offered. Under the Yo Pips rules page, expert advisors and indicators are allowed unless they break a prohibited-practice rule, and overnight holding is allowed. The same rules page prohibits latency arbitrage, high-frequency or feed-delay exploitation, account or device sharing, and strategies built to exploit the simulated environment.
A discretionary comparison of two charts by eye does not fall into those categories on its face. A script that reacts to delayed or stale feed prices could fall under the feed-delay rule, so check the rules before you automate anything. Check the current rules page for scalping/news/weekend rules before you use a method that depends on them. The daily loss figure counts floating profit and loss, commissions and swaps for the current day, so an open trade that moves against you counts before you close it. Checkout terms take precedence over the rules page, and rules can change, so confirm the current version before you trade.
For the full set of Yo Pips terms, see the Yo Pips rules and regulations page. You can also test a method on the free trial on a simulated account before you commit to a challenge.
Common mistakes
- Choosing the pair after seeing the divergence. The pair has to be fixed before you look for the pattern, or the result proves nothing.
- Calling every swing a divergence. Without a written swing rule, any two charts can be made to disagree.
- Mixing timeframes. A divergence on a 1-minute chart and a swing on a 1-hour chart do not describe the same market behaviour.
- Treating a failed high as a reversal without a stop. A divergence without a defined invalidation level is an opinion, not a plan.
- Oversizing because the setup looks clear. A clear-looking chart still produces losing trades. Size from the stop and the risk limit every time.
Frequently asked questions
01What is SMT in trading?
02Is SMT divergence a reliable signal?
03What is the difference between SMT divergence and RSI divergence?
04Which markets are used for SMT divergence?
05Do I need a prop firm account to study SMT divergence?
Risk disclosure: Trading leveraged products such as forex and CFDs carries a high level of risk, and most traders lose money. Prop firm challenges are evaluations on simulated accounts; passing one does not guarantee account activation, profits or a payout. Nothing on this page is investment advice. Always read the current rules and terms before you buy or start a challenge.