The RSI indicator is one of the most widely used tools on a trading chart. RSI stands for Relative Strength Index. It measures momentum, the size and speed of recent price moves, and plots the result as a line from 0 to 100 in a panel below the price chart. This guide answers the two questions new traders ask first: what RSI is, and how it is calculated and read. It shows the formula step by step, works one example through to the last decimal, and explains where the indicator helps and where it misleads.
What is the RSI indicator?
What is RSI?
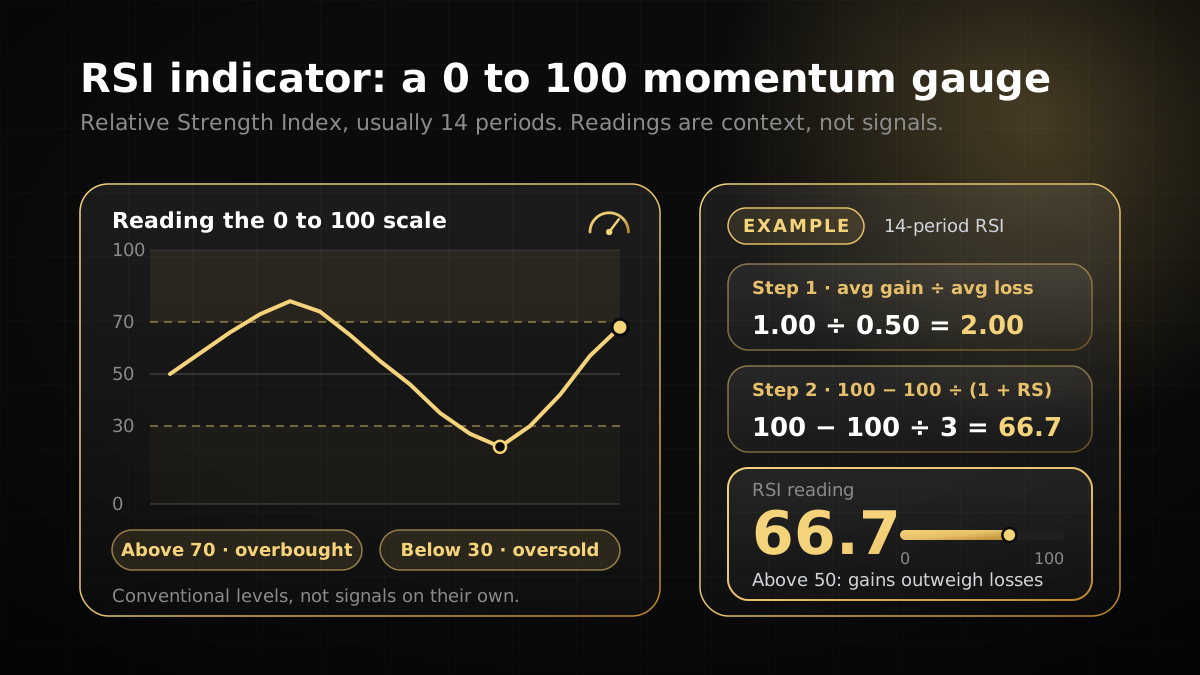
RSI is a 0 to 100 momentum oscillator. It compares the average size of recent up closes with the average size of recent down closes over a set number of bars, usually 14. A high reading means gains have dominated the window. A low reading means losses have dominated it.
J. Welles Wilder introduced the indicator in his 1978 book New Concepts in Technical Trading Systems. He used a 14-period window, and that setting is still the usual default on most charting platforms. Wilder’s version uses closing prices only, which means it can be calculated on any symbol and any timeframe, from a one-minute chart to a daily chart.
RSI is an oscillator. That means it moves between fixed bounds instead of following the price level. For that reason it is drawn in its own panel under the chart, not on top of the candles. The panel is useful because it lets you compare the momentum line with price on the same time axis.
How RSI is calculated
The standard formula has three steps. You work out average gains and average losses over the lookback period, divide one by the other to get relative strength, then convert that ratio to the 0 to 100 scale.
Step 1: average gain and average loss. Add up the gains and the losses over the last N price changes, where N is the period, usually 14. Divide the total gain by N to get the average gain. Divide the total loss, recorded as a positive number, by N to get the average loss.
Step 2: relative strength. RS = average gain ÷ average loss.
Step 3: RSI. RSI = 100 − 100 ÷ (1 + RS).
The first pair of averages is a simple mean over the first N changes. Every later bar uses Wilder smoothing. The new average gain is (previous average gain × (N − 1) + today’s gain) ÷ N, and the average loss works the same way with today’s loss. Smoothing means a large move keeps some influence for several bars instead of disappearing on the next close.
Two edge cases follow from the formula. If the average loss is zero, RS has no defined value and RSI is conventionally shown as 100. If the average gain is zero, RSI is 0. The result therefore always stays between 0 and 100.
Worked example: 14 periods step by step
The example below uses a hypothetical instrument that starts at 100.00 and has 15 closing prices, which gives 14 price changes. Those 14 changes form the first full window, so the first RSI reading uses the simple averages. The prices are invented so the arithmetic comes out exact. They do not come from any real market.
| Bar | Close | Change | Gain | Loss |
|---|---|---|---|---|
| 0 | 100 | start | – | – |
| 1 | 102 | +2 | 2 | 0 |
| 2 | 101 | −1 | 0 | 1 |
| 3 | 104 | +3 | 3 | 0 |
| 4 | 102 | −2 | 0 | 2 |
| 5 | 103 | +1 | 1 | 0 |
| 6 | 107 | +4 | 4 | 0 |
| 7 | 104 | −3 | 0 | 3 |
| 8 | 106 | +2 | 2 | 0 |
| 9 | 105 | −1 | 0 | 1 |
| 10 | 106 | +1 | 1 | 0 |
| 11 | 104 | −2 | 0 | 2 |
| 12 | 107 | +3 | 3 | 0 |
| 13 | 108 | +1 | 1 | 0 |
| 14 | 107 | −1 | 0 | 1 |
| Total | – | +7 | 17 | 10 |
The gains total 17 and the losses total 10. As a check, 17 − 10 = 7, and the close moved from 100 to 107, which is also a net change of 7. The table is consistent.
First reading, bar 14.
- Average gain = 17 ÷ 14 = 1.2143
- Average loss = 10 ÷ 14 = 0.7143
- RS = 1.2143 ÷ 0.7143 = 1.70, the same as 17 ÷ 10
- RSI = 100 − 100 ÷ (1 + 1.70) = 100 − 100 ÷ 2.70 = 100 − 37.04 = 62.96, shown as 63.0
Read the result this way. Over these 14 changes, the average up move was 1.7 times the average down move. That puts RSI in the upper part of the scale, but nowhere near an extreme.
Next bar, bar 15. The close is 105, a fall of 2 from 107. The averages now update with Wilder smoothing, using N − 1 = 13 and N = 14.
- Average gain = (1.2143 × 13 + 0) ÷ 14 = 15.7859 ÷ 14 = 1.1276
- Average loss = (0.7143 × 13 + 2) ÷ 14 = 11.2859 ÷ 14 = 0.8061
- RS = 1.1276 ÷ 0.8061 = 1.3987
- RSI = 100 − 100 ÷ (1 + 1.3987) = 100 − 100 ÷ 2.3987 = 100 − 41.69 = 58.31, shown as 58.3
The reading fell from 63.0 to 58.3 after one down bar. A single loss of 2 does not reset the indicator, because most of the earlier window still counts. Platforms keep more decimal places than this worked example, so their figure can differ in the last digit, but the method is the same.
Reading the 70 and 30 levels
Traders commonly mark 70 as overbought and 30 as oversold. These are conventions. They came from practice, not from a statistical test that applies to every market. A reading above 70 means recent gains were large relative to recent losses. It does not mean price must fall, and a reading below 30 does not mean price must rise.
| RSI reading | Common label | What it tells you |
|---|---|---|
| Above 70 | Overbought (convention) | Recent up moves have dominated. Momentum is strong and may be stretched. |
| 30 to 70 | Neutral range | No extreme reading. Look at price structure and the trend. |
| Below 30 | Oversold (convention) | Recent down moves have dominated. The move may be stretched. |
| Around 50 | Midline (convention) | Some traders read sustained readings above 50 as stronger momentum and below 50 as weaker momentum. |
In a strong trend, RSI can stay above 70 for a long stretch in an uptrend, or below 30 in a downtrend. A rule that sells every reading above 70 will keep fighting a trend that is still running. Many traders use the levels to ask a question rather than to give an order: is momentum stretched, and does price confirm it?
Divergence between RSI and price
Divergence is the most discussed use of RSI. Bearish divergence appears when price makes a higher high while RSI makes a lower high. Bullish divergence is the mirror image: price makes a lower low while RSI makes a higher low. Divergence describes a loss of momentum in the move. It does not give a time or a price for a reversal, and it can persist while price keeps trending for longer than a trader expects.
Check divergence on the same timeframe as your chart. Mark the two swing points on price and the two matching points on the RSI panel, then ask whether the difference is clear enough to matter. Small differences near the midline are often noise.
Period, timeframe and price settings
Period. The default is 14. A shorter period, such as 7, reacts faster and crosses the extremes more often, which means more noise. A longer period, such as 21, is smoother and slower. Changing the period changes the signal, so write down which setting you tested and keep it fixed.
Timeframe. RSI on a one-minute chart and RSI on a daily chart measure different things, because each covers a different window of price history. Read the level with the timeframe in mind, and do not compare a reading from one chart with a reading from another as if they were the same.
Price input. The standard version uses closing prices. Some platforms offer other inputs. Check the setting in MetaTrader 5 or your charting tool, so the value on your screen matches the value in your notes. For platform details, see our trading platforms page.
Limits of the RSI indicator
RSI is useful for describing momentum, but it has clear limits. These are the ones that matter most when you use it.
- It lags. RSI is calculated from past closes, so it usually confirms momentum after a move has started. It does not predict the start of a move.
- It stays extreme in trends. Readings above 70 or below 30 can persist for many bars when a trend is strong.
- It depends on settings. A different period, timeframe or price input gives a different line, so results from one setup do not carry over to another.
- It ignores volume and news. The standard formula uses only price changes. A gap on news can move RSI sharply while the chart does not show the cause.
- Thin markets distort it. Low liquidity can produce short, sharp spikes that push RSI to an extreme and back again within a few bars.
- It is not a signal on its own. Use RSI with price structure, support and resistance and your own rules. A single indicator is a weak basis for a trade.
If you want to understand the volatility side of a setup, the ATR indicator guide covers how range size can inform a stop, and the technical analysis for day trading guide places RSI alongside other tool families.
RSI, position size and prop firm rules
RSI describes momentum. It does not tell you how much to risk. Before you place a trade that uses RSI as one input, set the position size from your stop loss and your risk limit. The position size calculator guide shows that arithmetic, and it is the step most often skipped.
This matters most on an evaluation or funded account with a daily loss limit. On Yo Pips, the daily loss figure includes floating profit and loss, so a trade that moves against you counts toward the limit before you close it. A trade entered on an RSI reading and then left to run can use up the day’s room quickly. Under the Yo Pips rules page, EAs and indicators are allowed unless they break a prohibited-practice rule, and latency arbitrage and account or device sharing are listed as prohibited. Checkout terms take precedence, and rules can change, so check the rules and regulations page for the current wording, including the scalping, news and weekend rules.
For the wider structure of a challenge, including profit targets and loss limits, read our prop firm challenge guide. Pick the risk per trade first, then choose the indicator that fits your plan, not the other way round.
Frequently asked questions
01What is the RSI indicator used for?
02What does RSI mean?
03Is an RSI above 70 a sell signal?
04What period should I use for RSI?
05Does RSI work on every market?
06Can I use RSI on a prop firm account?
Risk disclosure: Trading leveraged products such as forex and CFDs carries a high level of risk, and most traders lose money. Prop firm challenges are evaluations on simulated accounts; passing one does not guarantee account activation, profits or a payout. Nothing on this page is investment advice. Always read the current rules and terms before you buy or start a challenge.