The ATR indicator answers a simple question: how far does this market usually move in one bar? Traders use it to size stops, to judge whether a market is quiet or fast, and to avoid placing a stop inside normal price noise. This guide covers the true range formula, how the average is calculated, a worked example with every step shown, and how ATR fits into stop placement and position sizing under a prop firm loss limit.
What the ATR indicator measures
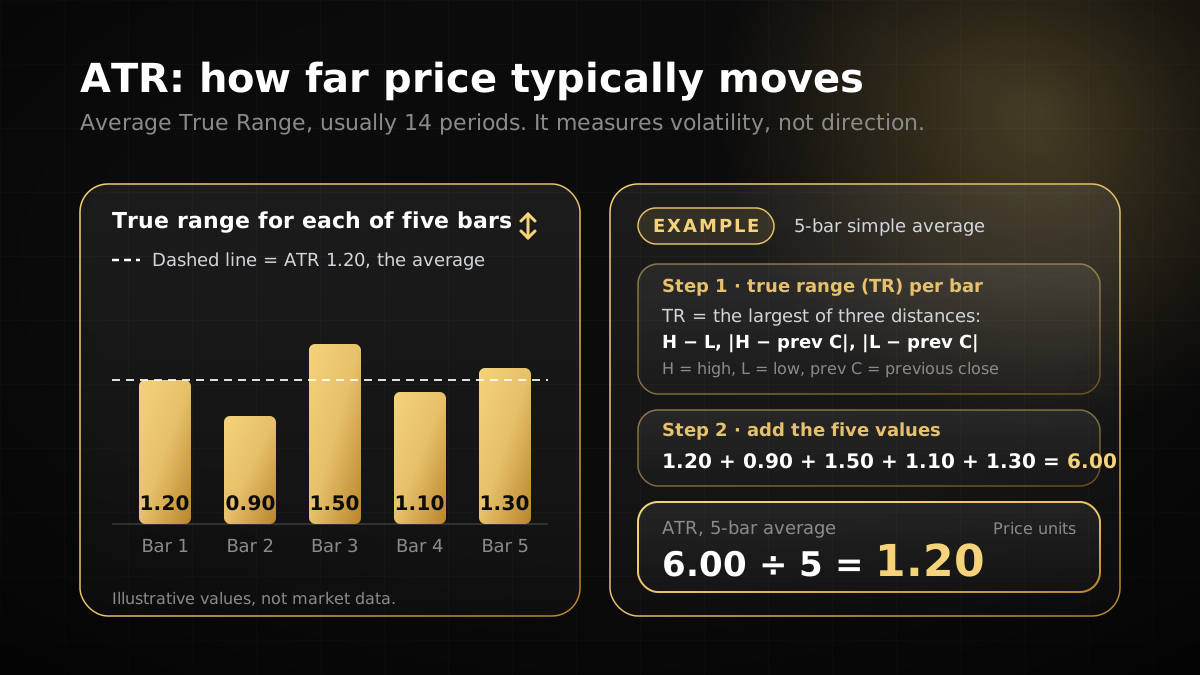
Average true range, usually shortened to ATR, is a volatility measure developed by J. Welles Wilder Jr. For each bar on a chart, it tracks how far price moved, including gaps between the previous close and the current bar. The result is averaged over a set number of bars and plotted in the same price units as the instrument, usually in a separate pane below the price chart.
ATR does not care whether price went up or down. A market that moves 40 pips a bar on the way down and one that moves 40 pips a bar on the way up produce the same ATR. That is the point of the indicator, and also its limit. It tells you how big the moves have been, not where they are going.
ATR is a smoothed average, so it reacts with a delay. A single session with a much wider range lifts the value only partly on the first bar. A quiet stretch lowers it gradually as well. Read it as a picture of recent conditions, not of the next bar.
The true range formula
Plain high minus low is not enough, because it ignores gaps. A bar that opens well above the previous close can have a short range inside itself while still moving a long way from where the market was. True range fixes this by taking the largest of three distances for each bar:
- High minus low, the bar’s own range.
- The absolute value of high minus the previous close, which captures an upward gap.
- The absolute value of low minus the previous close, which captures a downward gap.
In formula form: TR = max(High − Low, |High − Previous Close|, |Low − Previous Close|). Most bars use the first distance. The other two only win when the bar starts far from where the previous bar closed.
How ATR is calculated
The standard method, from Wilder’s original work, has three steps:
- Calculate the true range for each bar.
- The first ATR value is the simple average of the first N true ranges, where N is the period. For the common 14-bar setting, that is the average of the first 14 bars.
- Each later value smooths the previous one: ATR today = ((ATR yesterday × (N − 1)) + TR today) / N.
A longer period gives a steadier line that reacts more slowly. A shorter period reacts faster and changes more often. Many traders keep the default unless they have a clear reason to change it.
Not every platform uses this exact method. Some use a simple moving average of true range, and others use an exponential average. The value on your chart can therefore differ from the worked example below, so check the indicator settings in your platform before you compare numbers.
Worked example: ATR over five bars
The prices below are invented to keep the arithmetic short. They are not a real quote. The period is five bars so that every step fits on the page. The same method applies to 14 bars, with the same steps and more rows. Pips use a four-decimal quote, where one pip is 0.0001.
| Bar | High | Low | Previous close | High − Low | |High − prev. close| | |Low − prev. close| | True range (pips) |
|---|---|---|---|---|---|---|---|
| 1 | 1.1072 | 1.1025 | 1.1030 | 0.0047 | 0.0042 | 0.0005 | 47 |
| 2 | 1.1098 | 1.1055 | 1.1061 | 0.0043 | 0.0037 | 0.0006 | 43 |
| 3 | 1.1120 | 1.1040 | 1.1087 | 0.0080 | 0.0033 | 0.0047 | 80 |
| 4 | 1.1130 | 1.1100 | 1.1046 | 0.0030 | 0.0084 | 0.0054 | 84 |
| 5 | 1.1138 | 1.1105 | 1.1125 | 0.0033 | 0.0013 | 0.0020 | 33 |
Bar 4 shows the gap case. Its low (1.1100) sits well above the previous close (1.1046), so the distance from that close to the high (84 pips) is larger than the bar’s own range (30 pips). The true range is 84 pips. A high minus low calculation would have given 30 pips and understated the move.
Step 1: the first ATR. Add the five true ranges: 47 + 43 + 80 + 84 + 33 = 287 pips. Divide by five: 287 / 5 = 57.4 pips. The ATR at bar 5 is 57.4 pips, or 0.00574 in price terms.
Step 2: smoothing on bar 6. Suppose bar 6 has a high of 1.1125, a low of 1.1098 and a previous close of 1.1110. Its distances are 27 pips (1.1125 minus 1.1098), 15 pips (1.1125 minus 1.1110) and 12 pips (1.1110 minus 1.1098). The largest is 27 pips, so the true range is 27. With N = 5: ATR = ((57.4 × 4) + 27) / 5 = (229.6 + 27) / 5 = 256.6 / 5 = 51.32 pips.
The new bar was narrower than the average, so ATR fell from 57.4 to 51.32 pips. It did not drop to 27, because smoothing keeps most of the previous value. That is the behavior to expect from the indicator.
Using ATR for stops and position size
The most common use of ATR is to set the distance of a stop loss. A trader places the stop a chosen multiple of ATR from the entry, so that the stop allows for normal bar-to-bar movement. The multiple is a choice the trader makes and tests. It is not a standard, and it does not make a trade more likely to work.
Using the example above, suppose the account is $10,000 and the trader risks 1%, which is $100. The stop sits 1.5 × ATR from entry: 1.5 × 57.4 = 86.1 pips. On a USD-quoted pair, one standard lot moves $10 per pip, so the risk per lot is 86.1 × $10 = $861. Lot size = $100 / $861 = 0.1161, rounded down to 0.11 lots. At 0.11 lots, a full stop-loss hit costs about $95 before spread and commission, which is inside the $100 budget.
Two points follow. First, a wider ATR-based stop lowers the size for the same percentage risk, so higher volatility shows up as a smaller position rather than a bigger risk. Second, the stop still has to make sense on the chart. A stop set only by a multiple, with no regard for the structure the trade depends on, can sit in the wrong place. The full sizing steps are in the position size calculator guide, and the margin a position needs is covered in the margin calculator guide.
Reading ATR on a chart
ATR is easiest to use next to price. The table below sets out what a reading can and cannot tell you.
| Situation | What ATR shows | What ATR does not show |
|---|---|---|
| ATR rising | Recent bars have been wider on average | The direction of the next move |
| ATR falling | Recent bars have been narrower on average | That a breakout will not happen |
| A single ATR value | The typical bar size, in price units, on that chart’s timeframe | A price target, a forecast or a stop level |
| Two instruments with different prices | The typical move on each, in its own units | Which one is more volatile in percentage terms, unless you convert them |
ATR can help you judge whether a move is happening in a wide or narrow market. It does not say whether the move will hold. For a momentum reading, see the RSI indicator guide. For an intraday reference price, see the VWAP guide. Used together with price structure, these tools answer different questions, and none of them is a signal on its own.
ATR and prop firm loss limits
A prop firm’s daily loss limit sits on top of your own stop plan. Under the Yo Pips rules page, the loss limits on each programme are:
| Yo Pips programme | Daily loss limit | Maximum loss limit |
|---|---|---|
| 1-Step Pay Later | 4% | 8% |
| 2-Step Pay Later | 5% | 10% |
| Instant Funding | 3% | 6% |
The daily figure includes floating profit and loss, so an open trade that moves against you uses daily room before it closes. On a $10,000 account, a 4% daily limit is $400. The trade sized above risks about $95 if its stop is hit, roughly a quarter of that room. A trade that is $80 down has already used $80 of it. Checkout terms take precedence over the rules page, and rules can change, so confirm the current version before you trade.
Check the ATR stop, the lot size and the daily limit together. If the daily room is small, it may be the daily limit, not the chart, that decides how many trades you take in a session. The prop firm challenge guide compares the programmes side by side.
Common ATR mistakes
- Reading ATR as direction. A high ATR tells you the bars are wide. It does not tell you which way they will close.
- Mixing timeframes. A daily ATR is the wrong input for a stop on a one-hour chart, and the reverse is also true. Each ATR value describes the bars of the chart it is added to.
- Comparing raw ATR values across instruments. An ATR of 0.00574 on a currency pair and an ATR of 57 on an index are in different units. Convert to pips, ticks or percentage before you compare.
- Using high minus low instead of true range. That method misses gaps, so it can understate volatility after a gap at the open.
- Skipping the pip value. Convert ATR into the symbol’s own pip or tick value using its specification in MetaTrader 5 before you size the trade.
- Treating ATR as a signal. ATR does not say when to enter or exit. It sets a scale for stops and sizing, and the trade plan decides everything else.
Frequently asked questions
01What is the ATR indicator?
02What does ATR mean in trading?
03What is the default ATR period?
04Does a high ATR mean price will go up?
05Can you use ATR to set a stop loss?
06Is ATR the same as standard deviation?
Risk disclosure: Trading leveraged products such as forex and CFDs carries a high level of risk, and most traders lose money. Prop firm challenges are evaluations on simulated accounts; passing one does not guarantee account activation, profits or a payout. Nothing on this page is investment advice. Always read the current rules and terms before you buy or start a challenge.