A break of structure, usually shortened to BOS, is one of the most common terms in price-action trading. It describes the moment price trades beyond the swing point that defined the current move. Traders use it to judge whether a trend is still intact, and the term appears constantly in chart-reading courses, videos and forum posts. It is also loosely defined. Two traders can look at the same chart and mark different breaks. This guide sets out one clear way to read the term, shows where definitions differ and explains how to use a break of structure inside a risk plan. It describes price. It does not predict price.
What a break of structure is
Market structure is the sequence of swing highs and swing lows that price leaves on a chart. In an uptrend, price usually makes higher highs and higher lows. In a downtrend, it makes lower highs and lower lows. A swing high is a local peak with lower prices on both sides. A swing low is the reverse. How many candles must confirm a swing depends on the method you use.
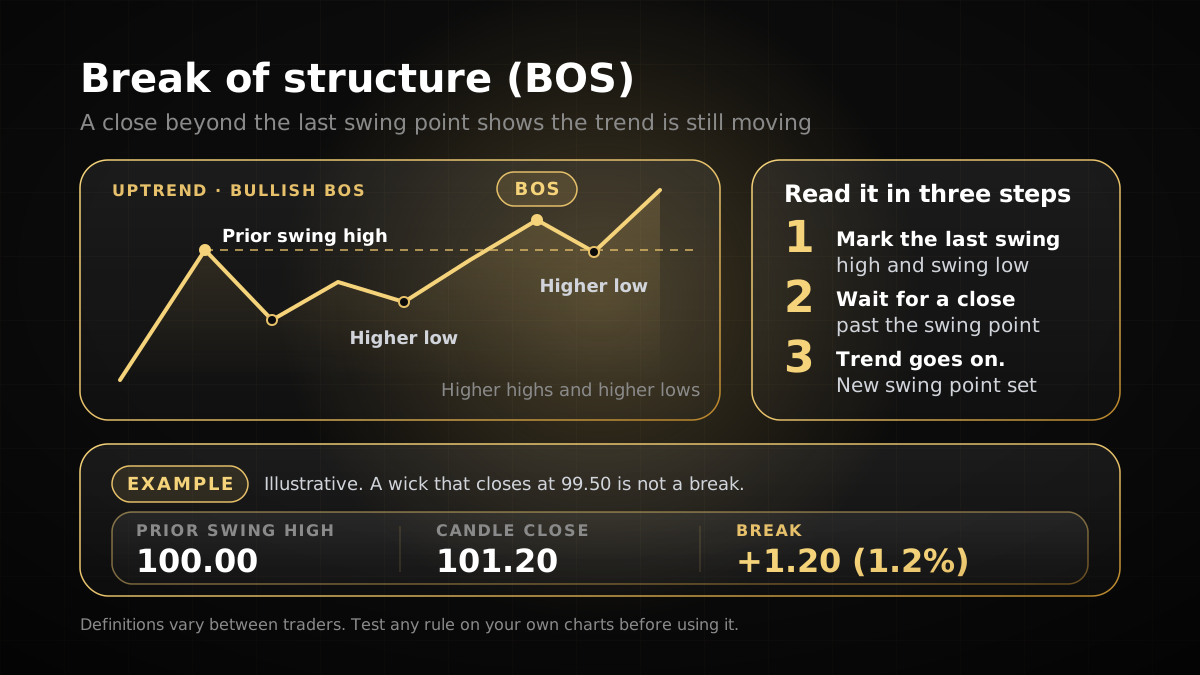
A break of structure happens when price moves beyond one of those swing points in the direction of the existing trend. In an uptrend, a bullish BOS is a move above the most recent swing high. In a downtrend, a bearish BOS is a move below the most recent swing low. The break tells you the trend has made a new extreme, so the structure is still advancing in the same direction.
Most traders who use the term want a close, not just a wick. A wick that pokes above a high and falls back inside the range is often called a sweep or a stop run rather than a clean break. Some traders accept a wick as a break. The choice changes which charts count, so treat it as part of your rule, not as a detail.
How traders mark a break of structure
A consistent method has four steps. Apply the same steps to every chart you review, so that your results can be compared honestly.
- Map the trend. Connect the swing points in order. Ignore single candles that do not form a clear high or low.
- Pick the defining swing. In an uptrend, this is the most recent swing high that price has not yet traded above.
- Wait for a close. Note the candle, the time and the closing price. A candle that trades above the swing and closes back inside the range is not a BOS under a close rule.
- Check the context. Was the move impulsive or a slow drift? Did it happen with a higher-timeframe trend or against it?
The third step is where most errors happen. Traders mark a break from an intraday wick, then find the candle closed back inside the range. Log the close, not the intention.
BOS and CHoCH: how they differ
CHoCH stands for change of character. In common usage, a BOS keeps the trend going, while a CHoCH is the first break against it. In an uptrend, a bearish CHoCH is a close below the most recent higher low, which may signal that the sequence of higher highs and higher lows is weakening. Some traders call the first break against the trend a CHoCH and any later break in the new direction a BOS of the new trend.
The labels describe a sequence of price action. They do not prove a reversal. A CHoCH can be followed by a continuation of the original trend, and a BOS in the trend’s direction can fail. Treat both labels as things to watch for, not as predictions.
A useful way to keep them apart is to ask which swing the break takes out. A BOS takes out a swing in the trend’s direction. A CHoCH takes out the swing that was holding the trend together. Once you know which swing is at stake, the label usually follows.
Where definitions differ
The term has no single authoritative definition. Its vocabulary comes from trader education and the smart money concepts community, not from an exchange or a regulator. Before you use a break of structure, write down which version you mean.
| Element | Common variants | What to decide |
|---|---|---|
| Swing point | A fractal (a candle with lower highs on each side), or a fixed look-back window | How many candles on each side confirm a swing |
| Break confirmation | A candle close, or an intrabar wick | Whether a wick counts as a break or as a sweep |
| Timeframe | A higher timeframe for trend and a lower one for entry | Which chart sets the structure you act on |
| Trend definition | The direction of the last BOS, or a moving average | What changes the trend in your rules |
| CHoCH | The first break against the trend, or any shift in the sequence of swings | Whether you act on a CHoCH or only watch it |
Changing any one of these variants changes which breaks you see. Two traders using the same name can mark different charts and reach opposite conclusions from the same price data.
Worked example: a bullish BOS on EURUSD
This example is hypothetical. The prices are chosen to show the arithmetic, not to suggest where EURUSD will go next.
An uptrend has a swing high at 1.0850. Price pulls back to a higher low at 1.0795, then rallies. The next candle closes at 1.0862, above the 1.0850 swing high. Under a close rule, that is a bullish BOS. Suppose you enter at 1.0862 and place the stop 5 pips below the pullback low, at 1.0790. The stop distance is 72 pips, because 1.0862 minus 1.0790 is 0.0072.
Now size the trade. Assume a $10,000 account and 1% risk per trade:
- Amount at risk: $10,000 x 0.01 = $100.
- Risk per standard lot: 72 pips x $10 per pip = $720. This assumes a USD-quoted pair such as EURUSD on a USD account.
- Lot size: $100 / $720 = 0.139, rounded down to 0.13 lots.
- Check: 0.13 lots x $720 = $93.60, which is under the $100 limit.
The same trade on a 1-Step Pay Later account needs one more check. The Yo Pips rules page sets a 4% daily loss limit, which is $400 on a $10,000 starting balance. If the stop were hit, the trade would use $93.60 of that room, about 23%. If price moved 40 pips against the position before the stop was reached, the floating loss would be 0.13 x 40 x $10 = $52, about 13% of the room, before any stop had triggered.
The break is only the trigger. The position size comes from the stop, and the stop comes from the chart. If you wanted a smaller loss, you would reduce the lot size, not move the stop closer to the entry just to fit a bigger position. The position size calculator guide shows the full sizing arithmetic.
The limits of the concept
A break of structure is a useful description, but it has real limits. Five are worth keeping in mind.
- Subjectivity. Two readers can choose different swing points on the same chart, and each choice changes which break is the break.
- Hindsight. A swing high is only confirmed after later candles form. A structure that looks clean in review can look different in real time. Scroll a chart forward one candle at a time, or log your marks before you know the outcome. Also check that your indicator does not redraw past swing points.
- False breaks and sweeps. Price often takes out a swing, triggers the orders sitting beyond it and then returns. The liquidity in trading guide explains why those orders gather at obvious highs and lows.
- Context. A counter-trend break on a lower timeframe can be a pullback inside a stronger higher-timeframe move. Reading the break without that context is a common mistake.
- No edge by itself. Knowing what a BOS is does not show that trades based on it are profitable. Measure your own results in a journal, over a sample large enough to mean something.
Using a break of structure inside a risk plan
A BOS works best as one input to a plan with fixed rules. Write the rules down before you open the chart:
- The maximum risk per trade, as a percentage of the balance.
- Where the stop goes: at the level that invalidates the idea, such as below the pullback low for a bullish BOS.
- The maximum number of attempts in a session.
- What you do after a stop is hit. Many traders stop for the day after a set number of losses.
On a prop firm evaluation, the plan also has to fit the loss limits. Under the Yo Pips rules page, checked 9 November 2026, the 1-Step Pay Later programme has a 4% daily loss limit and an 8% maximum loss limit. The 2-Step Pay Later programme has a 5% daily loss limit and a 10% maximum loss limit. Instant Funding has a 3% daily loss limit and a 6% maximum loss limit. The daily figure counts closed and floating profit and loss, commissions and swaps for the current UTC day. Checkout terms take precedence over the rules page, and rules can change, so check the current version before you trade.
Check the current rules page for scalping, news and weekend rules before you apply any short-term structure approach. Do not assume that a trading style is allowed. Practise the whole process on a simulated account first, which you can do through the free trial with no payment details. A supply and demand zones guide covers another common way to define levels that price may react to.
Frequently asked questions
01What does BOS mean in trading?
02What is the difference between BOS and CHoCH?
03Is a break of structure the same as a breakout?
04Should I trade every break of structure?
05Does BOS work on every timeframe?
06Does a daily loss limit change how I use BOS?
Risk disclosure: Trading leveraged products such as forex and CFDs carries a high level of risk, and most traders lose money. Prop firm challenges are evaluations on simulated accounts; passing one does not guarantee account activation, profits or a payout. Nothing on this page is investment advice. Always read the current rules and terms before you buy or start a challenge.