Tick scalping is a method that sits inside scalping, the broader style of holding trades for seconds or minutes. What sets it apart is the chart. Instead of one bar per minute, a tick chart draws a new bar after a set number of price ticks, so a busy market produces bars faster than a quiet one. Traders who use it look for moves of a few pips and repeat the process many times. This guide explains the method, shows why costs dominate a small target, works through the arithmetic for two targets, and covers how prop firm loss limits apply.
What is tick scalping?
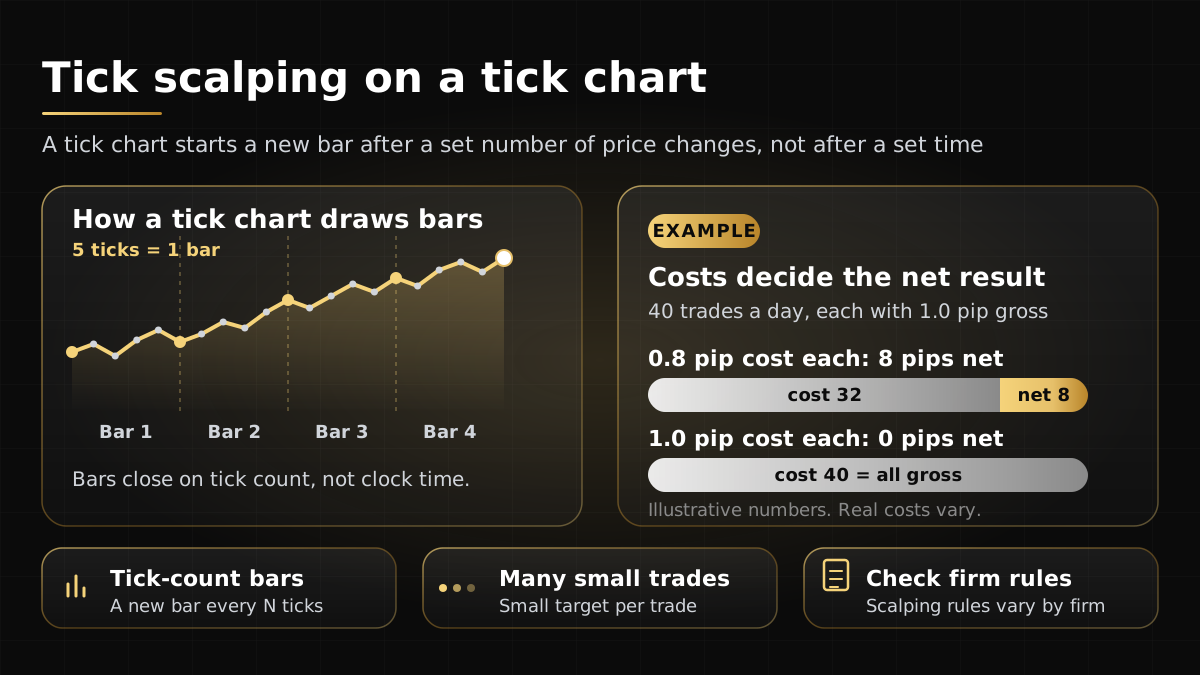
Tick scalping is a short-term method that trades on tick charts. A tick is a single price update. A tick chart counts those updates and closes each bar once it has collected a set number, such as 100 or 500. The trader then reads each bar, and the price action inside it, to look for a quick entry and exit.
The method is about activity rather than the clock. In a fast session, many ticks arrive in a few seconds, so bars form quickly and the chart shows more detail. In a quiet session, the same tick count can take several minutes, and the chart slows with the market. Some traders like this because the chart speeds up when something is happening. Others find it harder to plan around, because a bar’s length in time is never fixed.
Tick scalping is one form of the wider style described in our guide to scalping in trading. The holding period is still short. The difference is the chart used to find the trade.
Tick charts compared with time charts
The table compares a tick chart with a time chart. The tick count in the example is illustrative. Tick counts also depend on the data feed, so the same setting can produce different bars on different platforms.
| Feature | Time chart (for example, M1) | Tick chart (for example, 100 ticks) |
|---|---|---|
| When a bar closes | At a fixed clock interval, such as 60 seconds | After a set number of price ticks |
| Bar length in a quiet market | Same as always | Longer in time, so bars form slowly |
| Bar length in a busy market | Same as always | Shorter in time, so bars form quickly |
| Common default on MetaTrader 5 | Yes, M1 to MN1 are time-based | Not a standard MetaTrader 5 timeframe |
| Main risk for planning | Activity can be hidden inside a bar | Bar timing is uneven, so trade timing is harder to plan |
Neither chart is better in every case. A time chart makes it easier to plan a session and compare results across days. A tick chart can show a change in activity sooner. Choose the chart that matches your method, and test it before you rely on it.
Why costs dominate a small target
A tick scalp is built on small moves, so every fixed cost takes a larger share of the result. Three costs matter most. The spread is the gap between the buy and sell price, and you pay it on every round trip. Commission is a charge per trade, where the broker or platform applies one. Slippage is the difference between the price you expected and the price you got, and it can work for or against you.
The effect is asymmetric. A winning scalp keeps its target minus its costs. A losing scalp loses its stop plus the same costs. Costs make a win smaller and a loss bigger, so the win rate you need to break even rises. That is why a method that looks profitable on gross pips can lose money once costs are counted.
- Count the spread and commission before you enter, not after the trade closes.
- Compare the target with the total cost. If costs take most of the target, the setup needs a better reward before it is worth taking.
- Treat costs as part of the loss. A stopped-out trade loses the stop plus its costs.
Worked example: a 2-pip and a 3-pip target
The figures below are hypothetical. They are not Yo Pips costs, and your broker or platform may charge something different. Assume a round-trip spread of 1.0 pip, which is paid once per trade, and a commission equal to 0.5 pip per round trip. Total cost per trade is 1.5 pips. Assume a stop of 2 pips in both cases.
Net win is the target minus the 1.5 pips of cost. Net loss is the stop plus the 1.5 pips of cost. The break-even win rate is the share of wins at which the wins just cover the losses, which is net loss divided by the sum of net win and net loss.
| Line | 2-pip target | 3-pip target |
|---|---|---|
| Gross win before costs | +2.0 pips | +3.0 pips |
| Net win after 1.5 pips of cost | 2.0 − 1.5 = +0.5 pips | 3.0 − 1.5 = +1.5 pips |
| Net loss on a 2-pip stop | −(2.0 + 1.5) = −3.5 pips | −(2.0 + 1.5) = −3.5 pips |
| Break-even win rate before costs | 2 ÷ (2 + 2) = 50% | 2 ÷ (3 + 2) = 40% |
| Break-even win rate after costs | 3.5 ÷ (0.5 + 3.5) = 87.5% | 3.5 ÷ (1.5 + 3.5) = 70% |
Read the last two rows together. With the 2-pip target, the trader has to win about 87.5% of trades just to break even, because each win keeps only half a pip. With the 3-pip target, the break-even win rate falls to 70%. Costs push the required win rate up sharply in both cases, and the 2-pip target is the more demanding of the two. These are arithmetic results, not a forecast, and the example does not suggest that either win rate is achievable.
Now convert to money. On a USD-quoted major pair, one pip on one standard lot is worth about $10. A 3.5-pip net loss on one standard lot is therefore about $35. Eleven such losses in one day would total 38.5 pips, or about $385. On a hypothetical $10,000 account with a 4% daily loss limit, the limit is $400, so eleven losing scalps could leave very little room before a breach. Commissions and floating losses count toward that limit, as the next sections explain.
Slippage and fills
Slippage matters more in tick scalping than in slower styles. A small target can be missed by a fill that arrives a pip away, and a stop can fill past its level when the market moves fast. Slippage is most likely in fast markets and around news releases, when the price can move between your order and the fill. Our slippage guide explains why fills differ from quoted prices.
Slippage is hard to plan for, and it does not appear in a simple worked example. Measure your own fills over a series of trades, then compare the average result with the cost you assumed. If the gap is large, the method needs a wider target or fewer trades, not a tighter hope.
How prop firm rules apply
Prop firms set their own rules on scalping, and the rules differ from one firm to the next. For Yo Pips, check the current rules page for scalping, news and weekend rules before you trade a tick method. Under the Yo Pips rules page, checkout terms take precedence and rules can change, so confirm them on the day you trade.
Some Yo Pips rules apply to any short-term method. Expert advisors and indicators are allowed unless they break a prohibited-practice rule. Latency arbitrage and high-frequency or feed-delay exploitation are prohibited. For high-frequency trading itself, the rules page and the rulebook word the rule differently, so check the current rules page. Account or device sharing and strategies built to exploit the simulated environment are also prohibited. Overnight holding is allowed. A tick method that depends on feed delay or on the simulated environment falls under the prohibited list, however it is labelled.
The loss rules matter just as much. On Yo Pips, the daily loss counts closed and floating profit and loss, commissions and swaps for the current UTC trading day. A losing open scalp counts as soon as it moves into loss. The maximum loss is measured on equity, so floating losses reduce the buffer too. A breach closes the account, and a closed account is not eligible for a payout or refund unless a published promotion says otherwise. For a fuller picture, see our prop firm challenge guide.
Risk controls for a small-target method
A small-target method leaves little room for error, so the controls need to be tight and written down before the session starts.
- Set the size from the daily limit. Work out how many full stops fit inside the daily loss limit, including costs, then size each trade so that a run of losses cannot reach the limit. Our position size calculator guide shows how to turn a risk amount into a lot size.
- Set a cost floor. Skip any setup where the target is not a clear multiple of the expected cost. The right multiple is a judgement for your own plan, not a fixed figure.
- Stop after a run of losses. Decide in advance how many losing trades end the session, and keep to it even when the next setup looks clear.
- Track costs separately. Record spread, commission and slippage for every trade so you can see what the method really pays.
- Practise first. A free trial runs on a simulated account with no payment details, which is a low-cost place to test how the chart and your costs behave.
None of these controls guarantees a profit. They limit how much one bad session can cost, which is the main job of a risk plan.
Frequently asked questions
01What is tick scalping?
02Is a tick chart the same as a one-minute chart?
03Why do spreads matter more for tick scalping?
04Is tick scalping allowed on Yo Pips?
05Does tick scalping work on MetaTrader 5?
06Does tick scalping guarantee a profit?
Risk disclosure: Trading leveraged products such as forex and CFDs carries a high level of risk, and most traders lose money. Prop firm challenges are evaluations on simulated accounts; passing one does not guarantee account activation, profits or a payout. Nothing on this page is investment advice. Always read the current rules and terms before you buy or start a challenge.